Three Years of TSA Throughput Data
These photos taken almost 2 years apart illustrate the drastic dropoff and dramatic comeback in air travel passenger volume. Yet even these pictures have difficulty in conveying just how fast and far those volumes dropped.
The TSA Throughput Project
How do I know this? Well, it turns out that the TSA publishes the number of passengers screened at all domestic airports on a regular basis. They make this information available on their Freedom of Information Act (FOIA) Reading Room website. During the pandemic, as a sort of deranged therapy, I started tracking the TSA Throughput on a regular basis. This took a bit of work as the TSA only publishes their data in PDF format (more on this later).
Both pictures are of the Alaska Airlines lobby in SEA. The left one is from my March 22, 2020 flight to LAS, I was just one of 7,642 SEA passengers screened by TSA that day (compared to 55,933 on March 22, 2019). The one on the right is from my Christmas day 2022 trip when 44,527 passengers were screened by TSA.
SEA would finally bottom out on April 8th, 2020 with just 2,564 passengers screened at all TSA checkpoints. Please note that this total does not include passengers who may be connecting in SEA as they usually do not need to go through TSA.
I’ll cover SEA and other airports in a future post, but for now let’s take a look at the aggregate of passengers screened across the country for the past 3 years.
It’s not hard to figure out when COVID came in full force. We went from roughly 2M passengers being screened on a daily basis to less than 100K on April 8th, 2020. That’s just over 4K passengers screened an hour for the entire country!
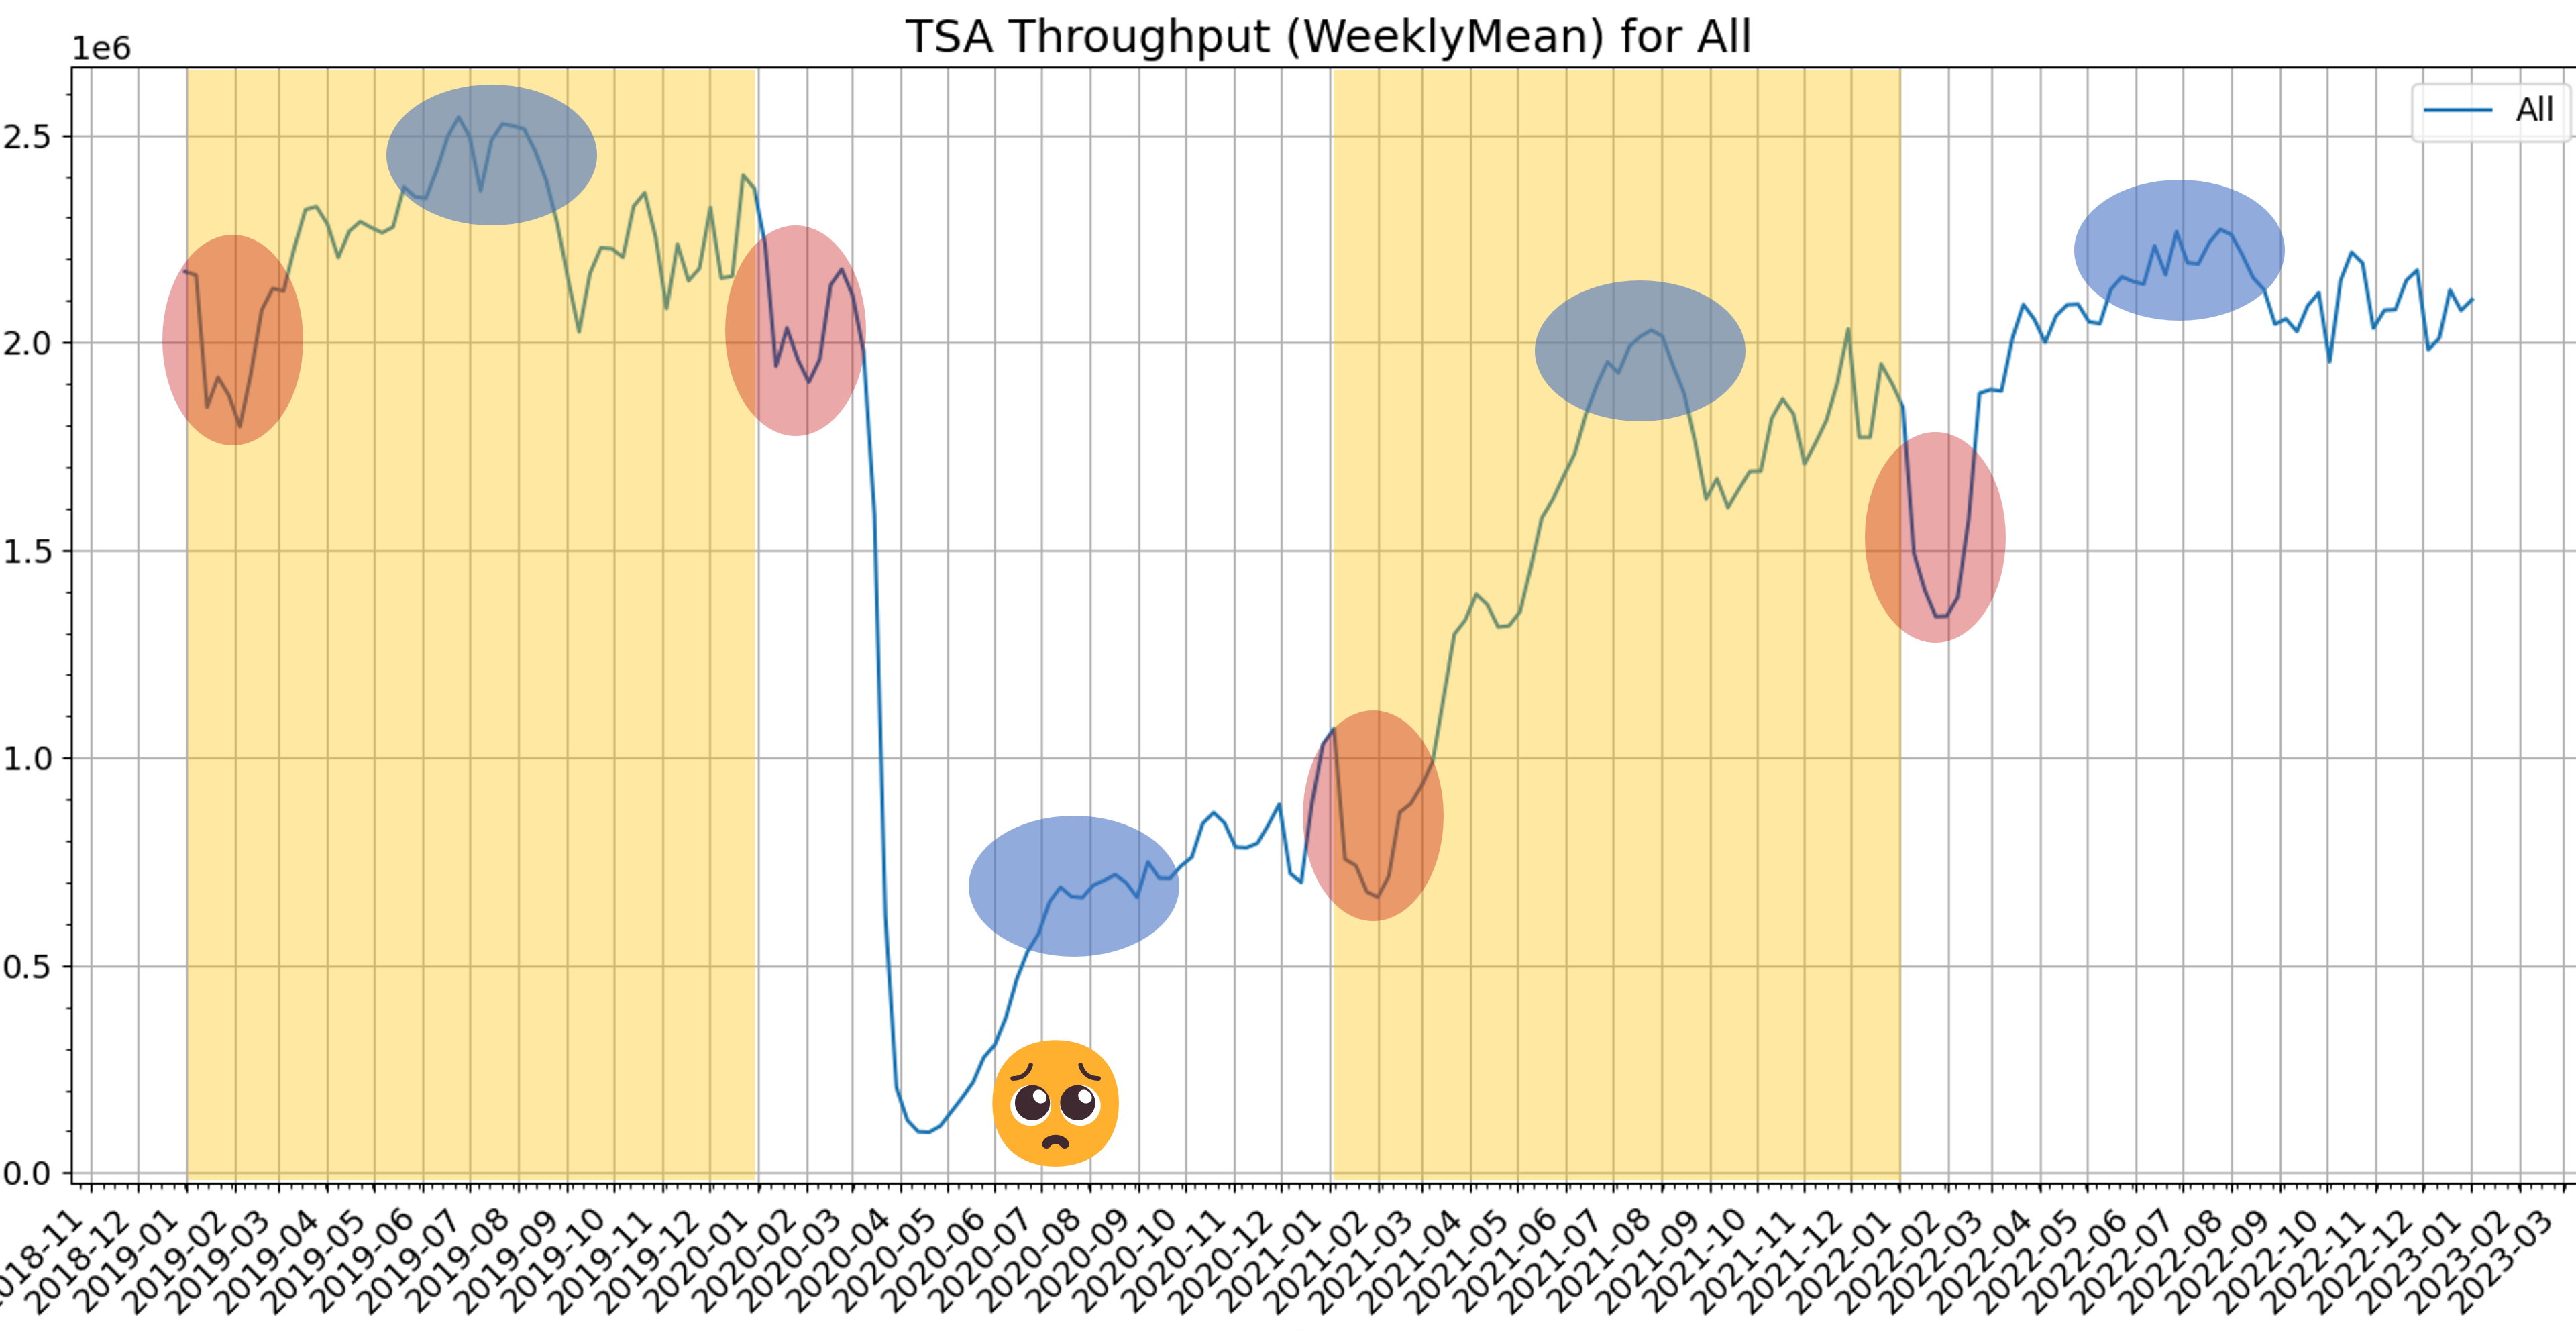
3 Years of Data
If we take the weekly mean of passenger throughput for the past three years, we can quickly see three interesting points.
- The sad state of airline travel in 2020 from April onwards.
- The peaks in Summer Travel are still present in 2021, 2022, although still not up to 2019 volumes.
- The traditional 1st Quarter Drop in volume is much more pronounced in 2021 and 2022.
Being in the airline industry (and any service oriented industry) in 2020 was not fun. I remember volunteering to clean planes as they came into SEA. It was truly depressing to see a plane come in and only 6 people get off (usually these were airline employees). After two days of this, I realized my time would be much better spent working in the backoffice. Our hours were reduced by 10%, and that’s when I started working on this side project. :)
As I mentioned, the TSA publishes these numbers in PDF format, so in order to make the data more useful (and learn a few new skills) I created the TSA Throughput Project on Github. In future posts, I’ll talk about the architecture, individual airport trends, and how others are using the data.
Let’s Connect
You can reach out to me on:
- Mastodon - @mikelor@awscommunity.social
- GitHub - @mikelor
- LinkedIn - mlorengo
- Twitter - @mikelor